有限公司")
有限公司")


Equipment Details
Device Description
I. Company Background
Company: Suzhou Hongji Precision Plastics Co., Ltd. (Note: Real client, data desensitized)
Industry: Automotive Parts + Medical Consumable Injection Molding
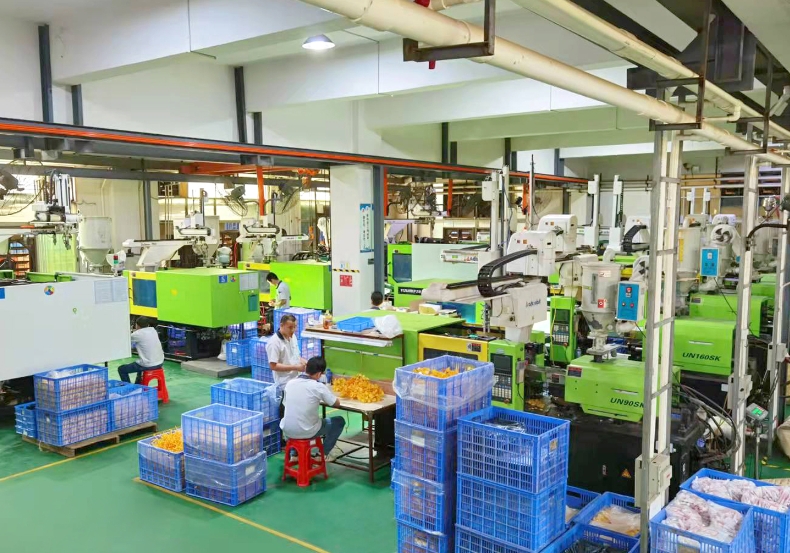
Equipment Scale: 32 injection molding machines
Major Brands: FANUC (8 units), Sumitomo (5), Haitian (12), Yizumi (4), plus 3 older domestic miscellaneous brands
Control Systems: 7 different protocols — FOCAS, EUROMAP, KEBA, Techmation, KeQiang, etc.
II. Core Pain Points: Extremely Low Standardization, Data Stranded in Silos
Hongji's predicament is the reality of most injection molding companies:
1. "Universal Brand" Equipment — Incompatible Protocols
The shop floor runs 5 brands and 7 control systems simultaneously. FANUC uses the closed FOCAS protocol, Sumitomo uses EUROMAP 63, while Haitian and Yizumi use Techmation and KEBA controllers respectively.
Different machines cannot "talk" to each other. To collect data, the workshop had to run 3 different middleware platforms in parallel — enormous maintenance burden, with frequent data conflicts.
2. Severe Data Lag — Production Management by Guesswork
Without automated collection, operators manually record machine parameters on paper every 2 hours. Clerks then transcribe them into Excel.
Data lag: 4–6 hours. By the time an anomaly is detected, defective parts have already been produced in batches. The worst incident: a worker secretly altered parameters on a Haitian machine, scrapping 3,400 automotive interior parts in one go — a direct loss exceeding ¥80,000.
3. Process Standards Cannot Be Enforced
Although the company has defined standard process parameter sheets, workers can freely modify temperature, pressure, hold time, and other key parameters on different machine panels.
Quality department only discovers issues during post-inspection — too late. On average, scrap losses from parameter tampering run ¥35,000 per month.
4. OEE Is Merely a Number on Paper
Manually recorded utilization rates deviate heavily from reality. For example, one key machine was recorded at 85% utilization, but actual effective output was only 62% of rated capacity.
Management cannot determine whether the cause is equipment failure, long changeover times, or worker slacking.
III. Solution: Non-Intrusive Collection + Unified Protocol Conversion
Hongji adopted our equipment data collection system in March 2025. Total implementation: 12 days (zero production downtime).
| Phase | Tasks | Duration |
|---|---|---|
| Days 1–3 | Site survey, communication testing, collection plan finalization | 3 days |
| Days 4–8 | Install data collection gateways, connect all 32 machines | 5 days |
| Days 9–10 | System integration, data validation, exception handling | 2 days |
| Days 11–12 | Operator training, go-live | 2 days |
Technical Highlights:
All-in-One Gateway: Our industrial smart gateway supports OPC UA standard protocol, and is simultaneously compatible with FOCAS, EUROMAP 63/77, Techmation, KEBA, KeQiang, and other mainstream controller protocols — truly "one gateway, all machines."
Non-Intrusive Deployment: Uses network interface + I/O signal monitoring. No modification to OEM PLC programs. No line disconnection, no retrofit, no production stop — fully avoiding warranty void risks.
Standardized Data Output: All 7 protocols are cleaned and converted into a unified format, pushed via MQTT to the client's existing MES system — seamless integration.
IV. Results (6 Months After Go-Live)
All data sourced from the client's actual reports:
Result 1: 100% Process Parameter Monitoring — Zero Tampering
All parameter changes are now traceable and alertable. Unauthorized modifications have been completely eliminated.
| Metric | Before | After |
|---|---|---|
| Parameter tampering incidents | 28/month | 0/month |
| Monthly scrap loss from parameter anomalies | ¥35,000 | ¥0 |
Result 2: Significant Yield Improvement
Real-time monitoring of key process parameters (temperature, pressure, hold time) triggers alerts the instant a parameter exceeds limits — operators can intervene within 30 seconds.
| Product | Before | After |
|---|---|---|
| Automotive parts yield rate | 94.2% | 98.7% |
| Medical consumables yield rate | 96.5% | 99.2% |
Result 3: OEE Accurately Revealed
The system automatically calculates true OEE (availability × performance × quality). Management sees real data for the first time.
| Metric | Before | After |
|---|---|---|
| Plant-wide average OEE | 58.3% | 71.6% |
| Equivalent hidden capacity released | — | 4.2 machines |
Result 4: Data Automation — Manpower Freed
Paper work orders and manual Excel entry eliminated. Data is generated in real time automatically.
2 full-time clerks previously dedicated to data entry have been reassigned to the quality department.
Result 5: ROI
| Item | Amount |
|---|---|
| Total project investment (gateways + software + services) | ~¥180,000 |
| Annual direct benefit (reduced scrap + increased output + labor savings) | ~¥470,000 |
| Payback period | Under 5 months |
V. Client Testimonial
"We tried two other data collection companies before — both said our equipment was too mixed to handle. Your team came in and connected every single machine in under two weeks. Now I can see real-time parameters for every machine from my office. If a parameter is changed or a machine alarms, I get an alert on my phone instantly. This investment was worth every penny."
— Li Guoqiang, Production Director, Suzhou Hongji Precision Plastics Co., Ltd.
VI. Key Metrics at a Glance
| Indicator | Before | After | Improvement |
|---|---|---|---|
| Equipment brands covered | 5 | All | 100% |
| Collection protocols | 7 mixed | Unified | Protocol standardized |
| Data lag | 4–6 hours | Real-time (seconds) | −99% |
| Parameter tampering | 28/month | 0/month | −100% |
| Overall OEE | 58.3% | 71.6% | +13.3 pp |
| Monthly scrap loss | ¥35,000 | ¥0 | −100% |
Application scope


